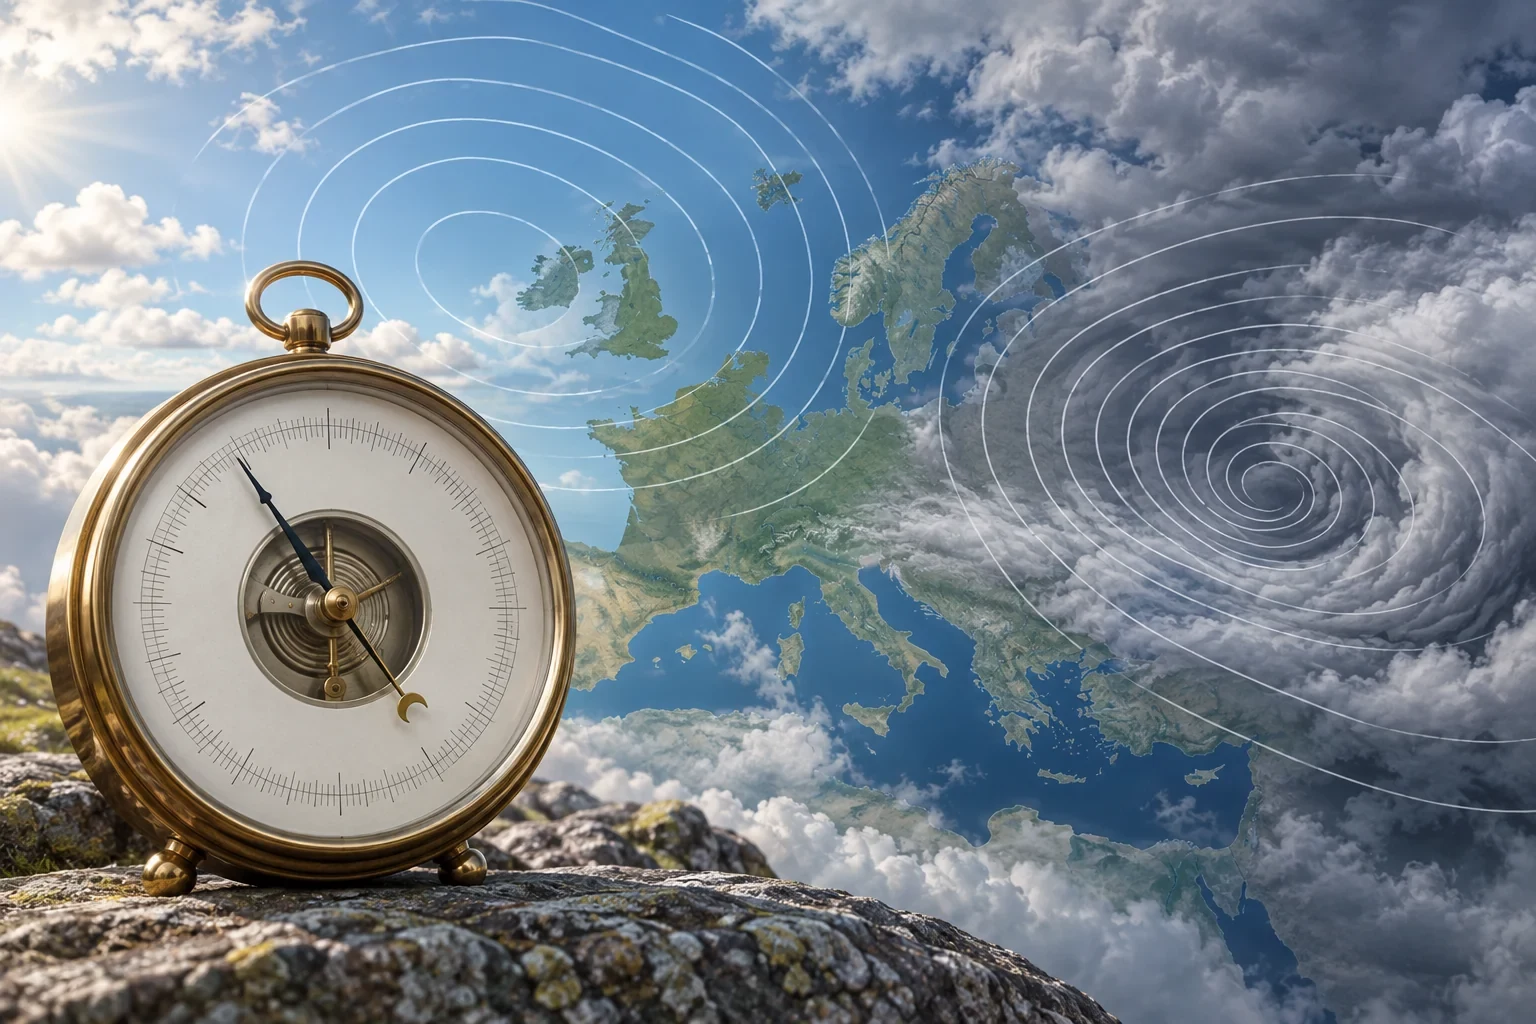
Atmospheric pressure appears on weather stations, apps and charts as a number followed by hPa. A reading of 1005, 1013 or 1025 hPa may look like a forecast by itself, but it is not. To interpret it, you need to know the reference height, compare it with the surrounding area and watch how it changes over time.
This is an educational guide, not a current warning. For weather-sensitive decisions, always consult the official meteorological service and active warnings for your location.
What atmospheric pressure measures
The atmosphere has mass and exerts force on the surface. Atmospheric pressure expresses that force per unit area. Meteorology commonly uses the hectopascal (hPa). One hPa has the same numerical value as one millibar, so 1013 hPa is equal to 1013 mb.
At mean sea level, 1013.25 hPa is a standard-atmosphere reference. It does not mean that readings above it always bring sunshine or readings below it always bring rain. Forecasters are more interested in whether pressure is higher or lower than in neighbouring areas and how the whole pattern is evolving.
Station pressure and mean sea-level pressure
Pressure decreases with height. A barometer in an elevated town naturally records lower pressure than one near sea level, even when both are under a similar weather pattern. Direct readings from different altitudes should therefore not be compared without adjustment.
Surface weather charts normally show pressure reduced to mean sea level. This calculation makes stations at different elevations comparable and allows isobars to be drawn. A home station may display absolute station pressure, adjusted relative pressure or both; check its settings before interpreting the figure.
What highs and lows can tell you
- High pressure: pressure is relatively higher than in the surrounding area. Descending air often supports more settled conditions, but fog, low cloud, heat, cold or trapped pollution can still occur.
- Low pressure: pressure is relatively lower than nearby. Rising air may organise cloud, fronts, precipitation and wind, but a low does not guarantee rain at every point.
Available moisture, temperature, fronts, terrain and the track of the system determine the actual weather. The central number of a high or low is not enough to estimate local impacts.
How to read a barometer trend
The trend is often more useful than a single value. A sustained fall means pressure is decreasing and may indicate an approaching low or front. A sustained rise may accompany the departure of a low or the building of higher pressure. A steady reading indicates little change in this parameter.
There is no universal rule that a certain fall guarantees rain. The rate, duration, synoptic situation and your position relative to the system all matter. Follow several hours of data rather than tiny jumps that may come from sensor resolution or poor calibration.
Isobars: lines of equal pressure
Isobars join points with the same mean sea-level pressure. Their shape helps identify high- and low-pressure centres, troughs and ridges. Their spacing is also useful: tightly packed isobars show a stronger horizontal pressure gradient and generally greater potential for stronger winds; wide spacing means a weaker gradient.
Actual wind direction and speed also depend on Earth’s rotation, friction and terrain. Isobars are not exact tracks followed by the air. To combine them with fronts and pressure centres, read our guide to reading a weather map.
A practical example
Imagine a correctly adjusted station falling steadily from 1021 to 1014 hPa. The sound conclusion is that pressure is falling. To know whether rain will arrive, check the chart, radar, cloud, warnings and official forecast. If it later rises to 1018 hPa, the disturbance may be moving away, but immediate clear skies are still not guaranteed.
Common mistakes
- Comparing absolute mountain pressure with pressure reduced to sea level.
- Treating 1013 hPa as a rigid dividing line between good and bad weather.
- Forecasting rain from one value without watching the trend.
- Assuming high pressure means no cloud or fog.
- Reading tightly packed isobars as an exact wind speed.
- Using a barometer with incorrect altitude or calibration.
Official sources
The central idea is simple: a barometer describes one part of the atmosphere. Its value improves when you know the height reference, follow the trend and place it within the complete weather pattern.