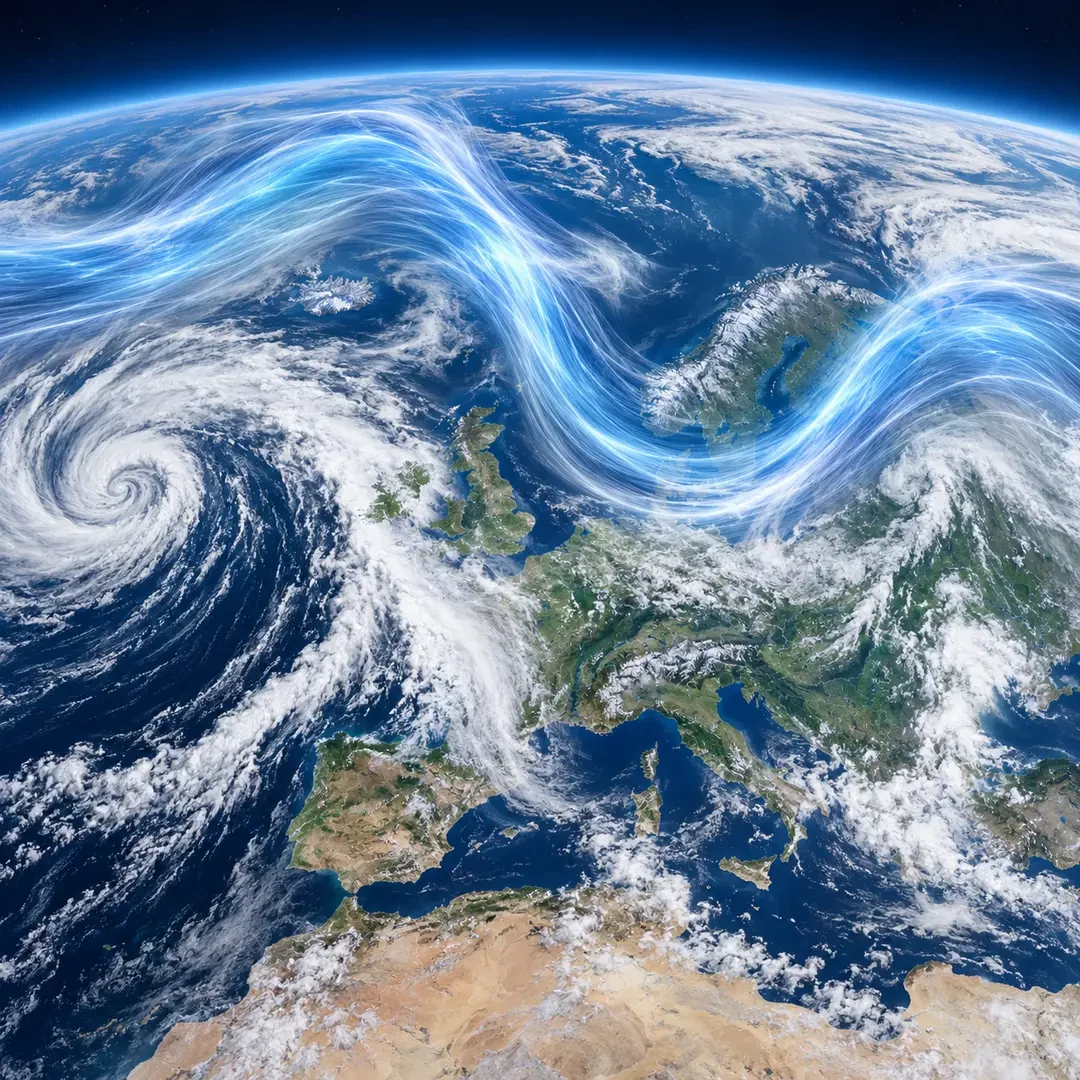
Weather charts often show it as a ribbon of wind snaking across the Atlantic and Europe. It is not a cloud, a front or a current you can feel at street level. The jet stream is a relatively narrow band of very strong winds near the top of the troposphere. Its position and shape help forecasters judge where low-pressure systems may travel and which regions are more likely to sit beneath colder, warmer or more settled air.
What exactly is the jet stream?
The polar jet is usually found near the tropopause, roughly 9-12 kilometres above the surface, although it does not remain at one fixed altitude. Nor is it a uniform tube. It may be hundreds of kilometres wide, vary greatly in speed along its length and shift north or south.
In the mid-latitudes it generally flows from west to east. It develops and strengthens where there is a pronounced horizontal temperature contrast between air masses. A sharper temperature gradient supports a larger change in pressure with height and therefore stronger upper-level winds. Earth’s rotation organises the moving air through the Coriolis effect.
Why does it sometimes run straight and sometimes meander?
The jet rarely traces a perfect line. A more zonal pattern runs relatively directly from west to east. A more meridional pattern contains ridges reaching north and troughs dipping south. These atmospheric waves resemble bends in a river, though the physics and scale are different.
When the flow is fast and fairly straight, low-pressure systems often move along quickly. When the waves are large and slow-moving, one pattern can persist: one region may endure repeated rain while another remains beneath a ridge with dry weather. A large wave does not automatically mean extreme weather, however. Moisture, stability, surface pressure and the structure of the atmosphere at other levels still matter.
How it steers lows and highs
The jet acts as a major steering current for mid-latitude weather systems. Atlantic depressions tend to move with the upper flow, although they do not travel exactly inside the fastest core. Certain entrance and exit regions of a jet streak also encourage rising air and can help a surface low deepen.
- Jet farther north: many Atlantic lows may track at higher latitudes, leaving parts of southern Europe more settled.
- Jet farther south: the storm track may approach the Iberian Peninsula and the western Mediterranean.
- Strong ridge: warmer air and higher pressure are often favoured beneath it, depending on the season.
- Deep trough: colder air can reach lower latitudes and instability may increase when enough moisture is present.
Why it is usually stronger in winter
During each hemisphere’s winter, the temperature contrast between polar and subtropical regions generally increases. The polar jet therefore tends to strengthen. In summer the contrast is usually smaller and the belt of strongest winds often shifts poleward. This is a broad seasonal pattern rather than a rigid calendar: the jet can change position and speed from one day to the next.
How to read a jet-stream chart carefully
Upper-air maps at 300 hPa — near 9 kilometres altitude — often display the jet using wind-speed colours and wind barbs. Look for three things: the position of the fastest band, the direction of its curves, and how the pattern is forecast to evolve. A single chart cannot provide a complete forecast for one town.
The jet shows the large-scale set-up, but a local forecast must combine it with surface pressure, fronts, temperature, humidity and precipitation guidance. Upper-level jet winds must not be confused with surface gusts: several kilometres of atmosphere and complex energy transfers separate the two.
Why it matters so much in Europe
Western Europe lies close to the usual route of North Atlantic weather systems, so modest shifts in the jet can greatly alter the distribution of rain, wind and temperature. A strong flow aimed at the continent may deliver a succession of fronts; a slow meander may support blocking and prolong one type of weather. Understanding this invisible current does not predict every storm, but it provides a crucial piece of the puzzle behind Europe’s rapid weather changes.
Technical sources: Met Office and NOAA JetStream.