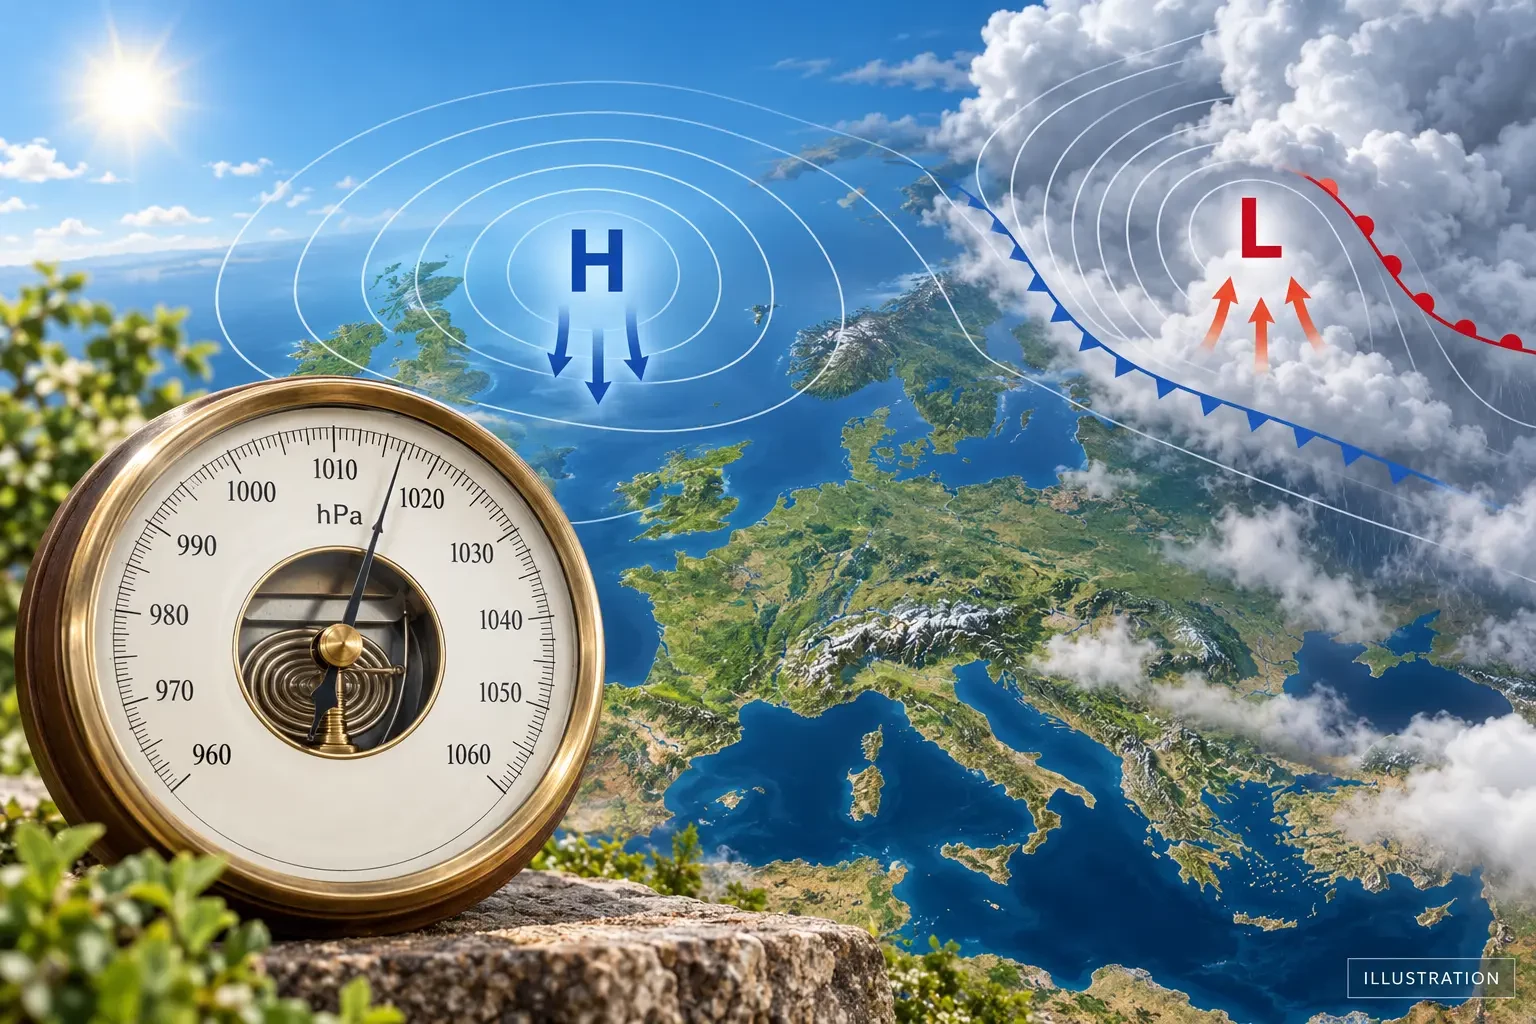
Atmospheric pressure appears on weather stations, apps and weather charts, usually in hectopascals (hPa). A single number can look decisive, but its meaning depends on altitude, the change over recent hours and the weather system around the location. This guide explains how to read it without treating a barometer as an infallible forecasting machine.
What is atmospheric pressure?
It is the force exerted on a surface by the column of air above it. Air is invisible, but it has mass. Standard sea-level pressure is 1013.25 hPa under the international reference atmosphere; that is a reference value, not a boundary between good and bad weather.
One hectopascal equals 100 pascals and has the same numerical value as the older millibar in meteorology: 1013 hPa equals 1013 mbar. Some English-language apps use inches of mercury (inHg), so check the unit before comparing readings.
Station pressure and mean sea-level pressure
Pressure decreases with height because there is less air overhead. MeteoSwiss gives useful indicative values: about 1013 hPa at sea level, around 850 hPa at 1500 metres and close to 500 hPa at 5500 metres. A mountain station can therefore report much lower absolute pressure without an exceptionally deep low-pressure system being present.
Weather charts normally use pressure reduced to mean sea level. This correction lets meteorologists compare places at different elevations and draw coherent high- and low-pressure systems. Before interpreting a home station, check whether it displays absolute station pressure or sea-level-corrected pressure.
The trend matters more than one reading
A reading of 1008 hPa does not announce rain on its own, and 1025 hPa does not guarantee sunshine. It is more useful to see whether pressure is rising, falling or steady, how quickly it is changing, and what the official forecast says.
- Falling pressure: may indicate an approaching or deepening low, a front, or rising air. It raises the possibility of changing weather but does not prove that rain will reach your location.
- Rising pressure: often accompanies a departing low or arriving, descending and more stable air. It does not rule out fog, low cloud, frost or wind.
- Steady pressure: suggests limited immediate change in the pattern, although a system may move without producing a large change at one sensor.
Small saw-tooth variations may come from the regular atmospheric tide or the sensor itself. Judge a trend over several hours rather than from two consecutive readings.
Highs and lows: associations, not absolute rules
In a low-pressure area, air tends to rise, cool and support cloud formation when enough moisture is present. Lows are often associated with fronts, precipitation and wind. In high pressure, descending air suppresses deep cloud development and usually favours more settled conditions.
There are important exceptions. A winter anticyclone can trap moisture and pollution near the surface, create persistent fog and keep valleys very cold. A low does not distribute rain evenly either: fronts, terrain, moisture flow and the system's track all matter.
What isobars tell you
Isobars are lines joining points with the same mean sea-level pressure. On surface charts they surround centres marked high (H) and low (L), revealing the pressure gradient.
- Tightly packed isobars: indicate a strong gradient and usually greater wind potential.
- Widely spaced isobars: indicate a weak gradient and generally lighter winds.
- Fronts: add information that pressure alone cannot provide, including likely zones of air-mass change, cloud and precipitation.
Wind does not simply blow in a straight line from high to low. Earth's rotation, surface friction and terrain alter its direction and speed. The complete chart is therefore more informative than the H and L labels alone.
How to use pressure in practice
- Check the unit and whether the value is corrected to sea level.
- Look at the previous 6 to 24 hours, not only the current reading.
- Check an isobar chart and the position of fronts and lows.
- Compare it with precipitation, wind, cloud and the chance of rain.
- For safety decisions, follow warnings from the official national weather service and civil protection authorities.
For example, a sustained fall as a front approaches can reinforce the evidence of an impending change. If the forecast keeps that front away from your area, however, the fall cannot supply an invented rain start time. Conversely, high pressure combined with high humidity, light wind and long nights may support fog even while the broad pattern is described as settled.
Common mistakes
- Comparing absolute pressure at a mountain site with sea-level pressure in a coastal city.
- Assuming every value below 1013 hPa is dangerous or every higher value means clear skies.
- Forecasting thunderstorms from one barometer without radar, satellite, models or observations.
- Confusing atmospheric pressure with blood pressure: they are different measurements.
Official and technical sources
- Met Office: high- and low-pressure systems.
- Met Office: surface pressure charts and isobars.
- NOAA JetStream: air pressure.
- MeteoSwiss: air pressure and altitude.
Pressure is a valuable part of weather diagnosis. Read as a trend within a synoptic chart, it helps explain why the weather is changing; on its own, it does not replace a forecast or an active warning.