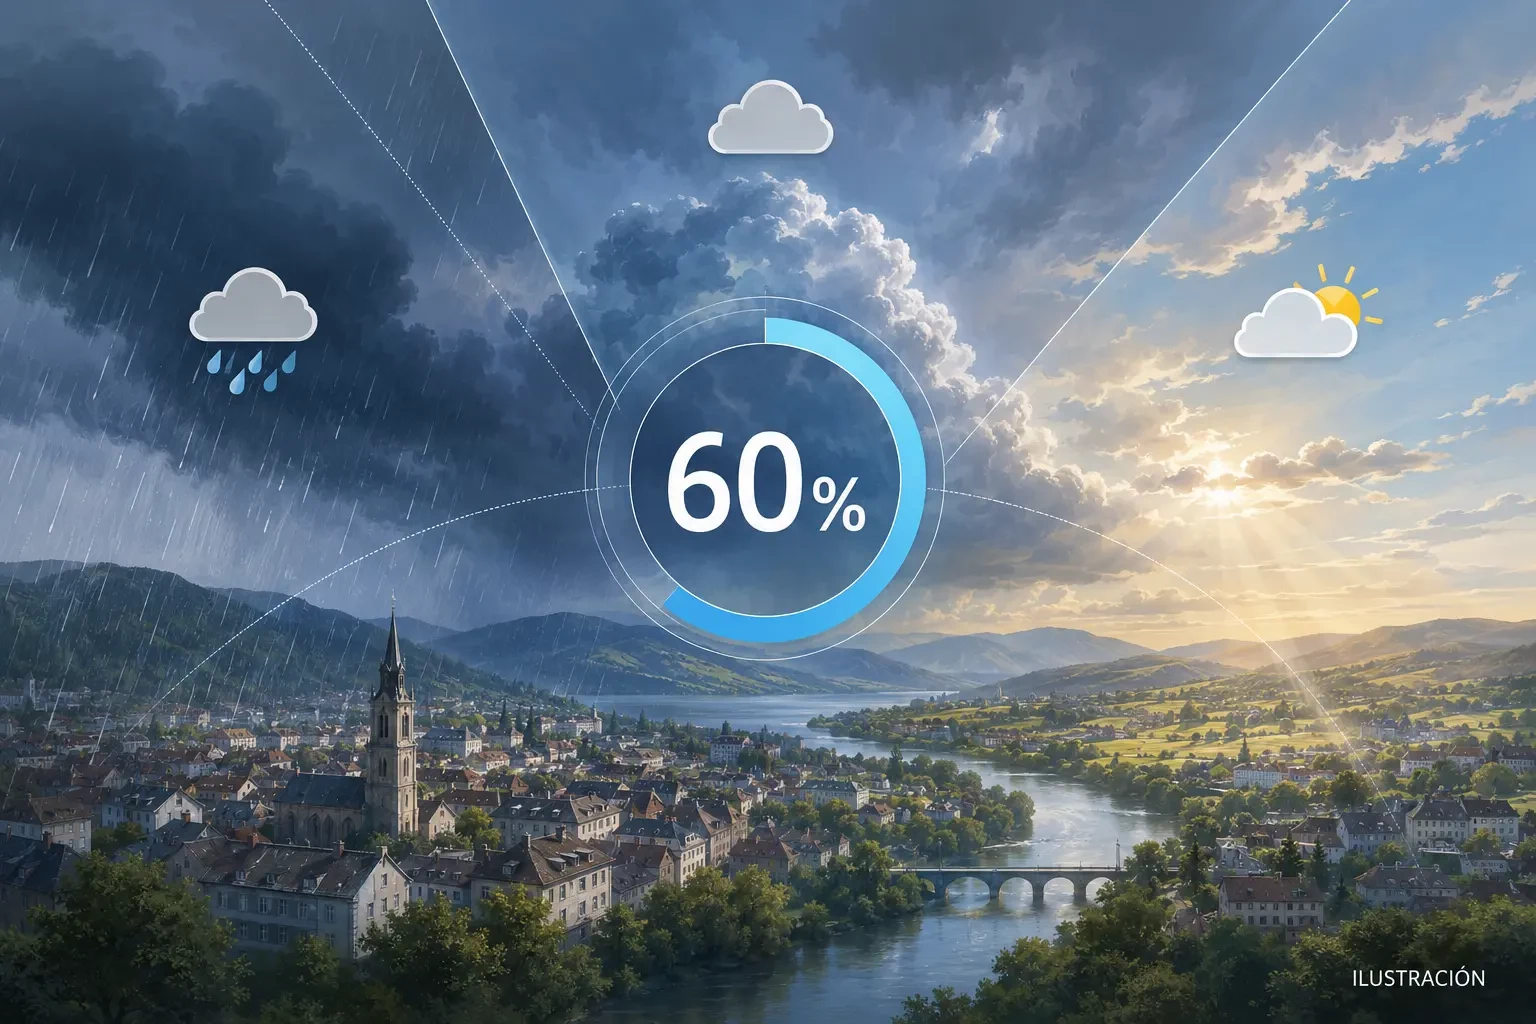
A 60% figure beside a rain icon looks simple, yet it is one of the most frequently misunderstood parts of a forecast. It does not mean rain will fall for 60% of the day, that 60% of the town will get wet, or that 60% of a maximum amount will fall. It expresses a probability tied to a particular location and time period.
The precise definition depends on the forecast product. In its municipal forecasts, Spain’s state weather agency AEMET defines precipitation probability as the percentage chance of any precipitation occurring during the stated period. Always read three elements together: percentage, location and time window.
What a 60% chance means
For the forecast point and period shown, 60% means rain is more likely than no rain, while a meaningful chance of staying dry remains. It measures uncertainty; it is not a promise about how long or how hard it will rain.
An intuitive way to think about it is to imagine many comparable atmospheric situations. In a well-calibrated forecast, events labelled 60% should produce precipitation roughly six times out of ten. This is a useful interpretation, although it is not a literal description of the calculation used by every app.
What the percentage does not tell you
- It does not give rainfall amount. A 90% chance may result in drizzle, while a 30% chance might involve a very intense, localised shower.
- It does not give duration. Rain could last five minutes or several hours within the same window.
- It is not automatically the percentage of an area that will be wet. Spatial coverage matters to forecasting, but “rain over 60% of the city” is not a universal replacement for the stated probability.
- It is not the same as thunderstorm probability. Widespread rain may carry little lightning risk, whereas isolated storms may have a lower chance of reaching one exact point.
Percentage and millimetres answer different questions
Probability answers “might precipitation occur here in this period?”. Forecast rainfall in millimetres answers “how much water might accumulate?”. Impact assessment requires both. Our guide to rainfall amounts, intensity and totals explains how to interpret those values.
Some probability products also show the chance of exceeding a threshold. AEMET’s probabilistic precipitation product, for example, uses 51 forecasts to estimate the probability of exceeding selected rainfall levels, alongside expected mean and maximum values. “Chance of any rain” and “chance of more than 10 mm” are different variables.
Why values differ by hour, place and app
A shower can move only a few kilometres and soak one town while missing the next. Its arrival may also shift in time. This sensitivity is particularly strong with small convective showers. Forecast providers may use different models, grid sizes, thresholds and periods, so comparing a daily percentage with an hourly one can create an apparent contradiction.
Nor should daily probability be obtained by adding hourly figures. Consecutive hours are related: when a front arrives, rain in one hour is not independent of rain in the next. Four hours at 40% therefore do not produce a 160% daily chance or permit any other simple sum.
How to use the figure when making a decision
- Check the time window. Distinguish the next hour, a six-hour block and the full day.
- Read the forecast amount. A high chance with a tiny total is a different scenario from a moderate chance with potentially heavy rainfall.
- Check how the situation is evolving. As the event approaches, use observations and learn how to read rainfall radar.
- Prioritise official warnings. An app percentage never replaces a warning for heavy rain, thunderstorms or flooding.
- Match caution to consequences. You may accept 40% for a short walk; work at height, a route through a flood-prone channel or an outdoor event calls for a wider safety margin.
A practical example
Suppose a hike from 16:00 to 19:00 has a 60% rain chance, a low mean accumulation and a possibility of locally heavy showers. The correct reading is not “it will rain for 60% of the afternoon”. There is a substantial chance of precipitation at that place and during that period, while amount and distribution remain uncertain. Check radar before leaving, identify shelter and look for official warnings.
Sources and responsible use
This guide explains forecasts; it is not a current warning. For safety-critical decisions, consult your national weather service and civil protection authority. Main sources: AEMET municipal forecast guidance and AEMET probabilistic precipitation guidance.