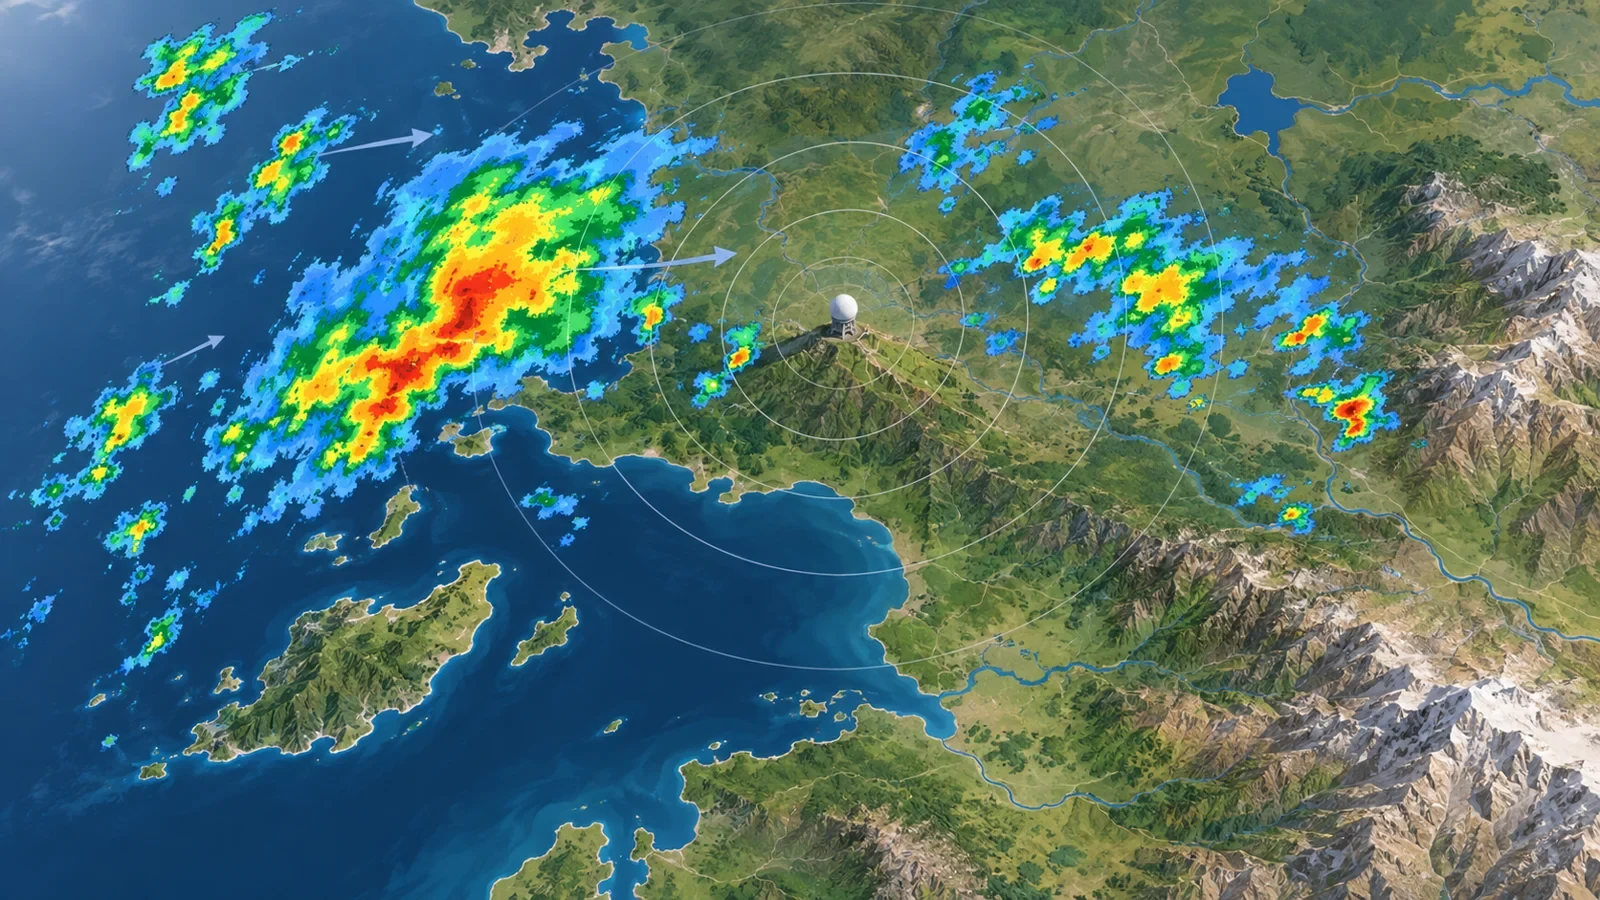
Weather radar is one of the most useful tools for seeing where precipitation is occurring now and how it has changed over recent minutes. Yet a colourful radar image is neither a direct photograph of rain reaching the ground nor an exact forecast for the next hour.
Reading radar well means separating three questions: what is being detected, how echoes are moving, and what may distort or hide the signal. That distinction helps when deciding whether to travel, exercise, work outdoors or postpone an event.
What radar actually detects
A radar sends pulses of energy and analyses the portion returned by raindrops, snowflakes, hail or other targets. Its basic product is reflectivity. Stronger returns are often associated with more numerous or larger hydrometeors, but the relationship with precipitation at the surface is not fixed.
The official AEMET radar service, for example, provides reflectivity in dBZ, echo-top height and estimated accumulations. These are different products: an instantaneous reflectivity image must not be read as an hourly rainfall total.
What the colours mean
Colours represent intervals on the scale chosen by the service or application. Green, yellow and red therefore have no universal value. A common palette uses cooler colours for weaker echoes and warmer colours for higher reflectivity, but the map legend is essential.
- Weak echoes: may indicate light precipitation, snow, virga or non-weather targets.
- Moderate echoes: suggest more organised precipitation, although surface intensity depends on cloud type and distance from the radar.
- Strong echoes: may accompany heavy showers, thunderstorms or hail, but colour alone confirms none of them.
A sharp colour change inside a cell is a reflectivity gradient, not a precise boundary on the ground. Conditions vary continuously between map pixels.
How to use the animation
A sequence helps estimate the apparent direction and speed of echoes. Watch several frames rather than comparing only the first and last. Follow recognisable features such as a core, a line or the edge of a broad band, and note whether their shape remains stable.
Projecting movement a short distance ahead can be useful, but thunderstorms grow, split and decay. A new cell may develop over you even when the previous echo passed elsewhere. Short extrapolation tends to work better for broad, stable rain bands than for rapidly changing convection.
Why rain may be poorly shown
The beam becomes higher above the ground with distance. Far from the site it may overshoot shallow precipitation. Mountains can partially or fully block the beam, while drizzle or rain from low cloud can be under-represented.
The opposite is also possible: radar may detect precipitation aloft that evaporates before reaching the surface. Compare the display with local observations, gauges and what you can see outside.
Echoes that are not necessarily rain
Terrain, buildings, wind turbines, insects, birds and unusual propagation can create returns. Modern processing removes many of them, but not all. Stationary echoes that keep the same outline, particularly close to the radar or known obstacles, should be treated carefully.
In wintry conditions, melting snowflakes can temporarily enhance reflectivity in a band. Intense precipitation can also attenuate the signal behind it, making the area farther away look artificially weak.
Observation versus forecast
Radar primarily describes recent observation. A forecast combines models, observations and analysis to estimate what comes next. Nowcasting projects recent data into the near future, but remains vulnerable to the birth and decay of showers.
For an outdoor plan, combine:
- the hourly forecast for the likely time window;
- radar for immediate evolution;
- official warnings for hazard, not merely whether rain is present.
A practical five-step method
- Check the timestamp and time zone of the latest image.
- Read the legend and identify reflectivity, accumulation or another product.
- Play the full loop and see whether echoes are growing or merely moving.
- Consider radar distance, terrain and possible coverage gaps.
- Before a safety-sensitive decision, consult the national weather service and Meteoalarm’s official European warnings.
The essential point
Radar answers “where is precipitation being detected now?” very well. On its own, it answers “exactly how much will fall here in an hour?” poorly. Colours require a legend, animation requires context, and safety decisions require forecasts and official warnings.