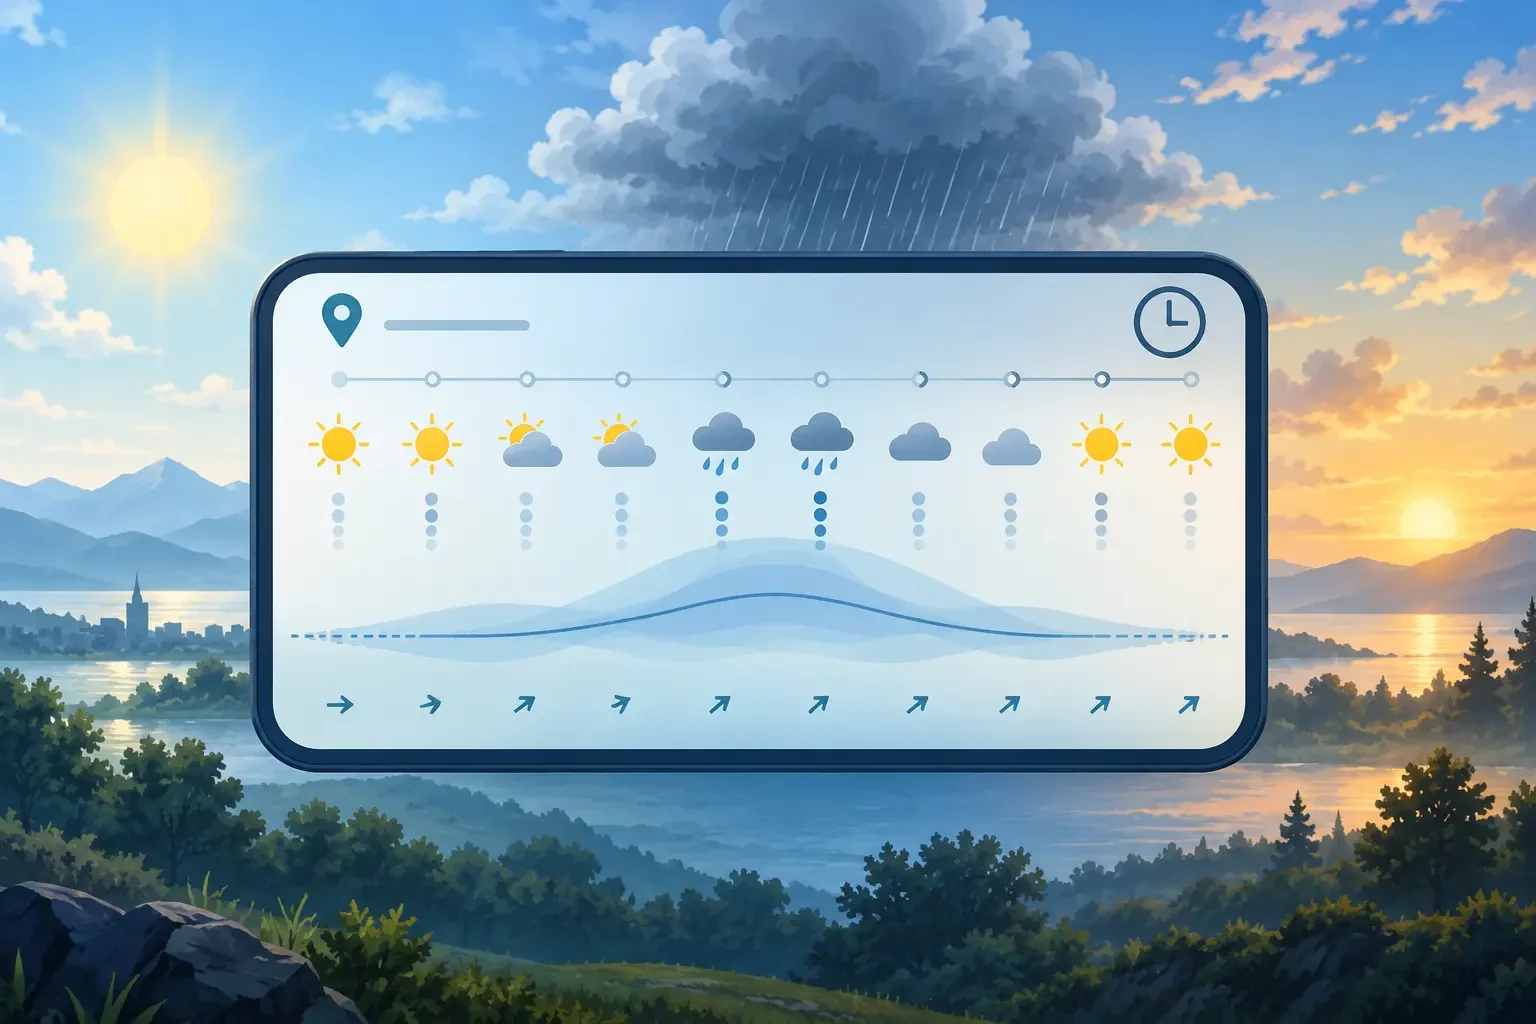
An hourly forecast is useful for choosing when to travel, exercise or work outside. It is also easy to expect more precision than it can provide. A rain symbol at 16:00 does not promise that the first drop will fall at exactly that minute everywhere in town.
The table divides a continuous atmosphere into convenient boxes. Read the sequence, not one isolated cell: valid time, location, rain probability and amount, average wind and gusts, temperature, feels-like value and official warnings.
What does the hour represent?
The label may refer to an instant or an interval, depending on the variable and provider. The AEMET interpretation guide, for example, defines temperature at the end of the period but hourly precipitation as the total during the preceding hour. Do not assume every number in a column describes the same minute.
Check the time zone and date change too, especially when travelling or viewing another region.
An icon is a summary
A sun, cloud or raindrop compresses several conditions into one symbol. It may show the most significant weather in the interval rather than every moment or every part of the forecast area. Two identical icons can hide different cloud cover, wind or rainfall probabilities.
If staying dry matters, read the icon with both the chance of rain and the predicted amount. High probability with a small total is not the same planning problem as a lower probability of an intense shower.
Probability and amount answer different questions
Probability describes the chance of measurable precipitation for the provider’s defined place and period. Millimetres describe an expected amount. Neither alone tells you how long rain will last or whether it will cover the whole town.
If 17:00–18:00 shows 60% and 0.4 mm, it does not mean rain for 60% of the hour or over 60% of the town. A sensible reading is that precipitation is a meaningful possibility, the central amount is small, and its precise timing and location remain uncertain.
Average wind and gusts
For cycling, coasts, hills, outdoor work or driving, average wind is only half the story. A modest hourly mean can include much stronger brief gusts. Read our guide to mean wind and gusts for the difference. Direction can also vary within the hour near fronts, showers, coasts and terrain.
Temperature and feels-like values
Air temperature is a physical forecast variable. A feels-like value estimates human exposure by combining temperature with wind and, depending on the index, humidity. Compare both for clothing and comfort, while remembering that sun, shade, activity and personal factors change the experience.
Why the forecast changes
Forecasts combine observations with numerical models. Each update adds newer data and may move a front or shower by a few hours. That does not automatically make the previous forecast worthless; it means the best estimate has evolved.
Ensemble systems run slightly different scenarios to sample possible outcomes. The ECMWF explanation of forecast uncertainty shows why wider disagreement means lower confidence in detail. The farther ahead the hour, the less literally a single value should be read.
A practical planning checklist
- Confirm the place, date and local time.
- Check when the forecast was updated and refresh it closer to departure.
- Read several consecutive hours to see the trend.
- Separate rain probability from amount and intensity.
- Compare average wind, gusts and direction.
- Use radar and nearby observations for the very short term.
- Check official warnings; they take priority over a routine app icon.
Plan a window, not a perfect minute
For an important activity, define a usable time window and a fallback: start earlier, delay, shorten the route or move indoors. A picnic needs flexibility; sailing, mountain travel and large events require specialist forecasts and risk-based decisions.
An hourly forecast is not the sky’s appointment book. It is most useful as a structured estimate of trends, ranges and confidence.