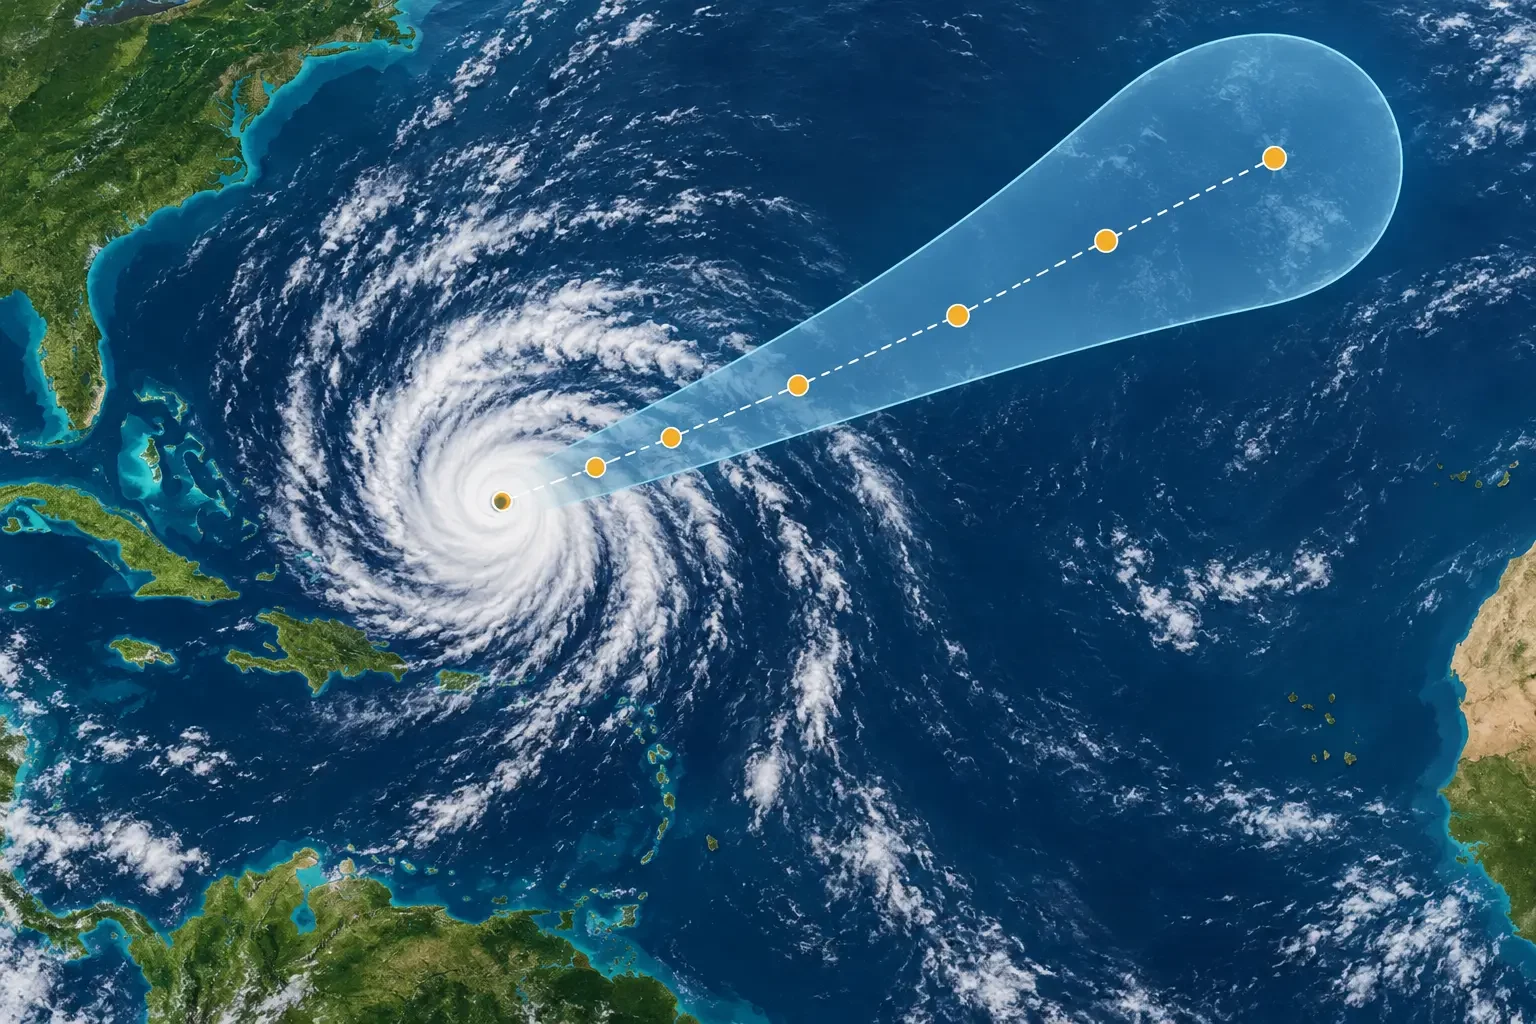
The forecast cone is one of the most widely shared graphics when a tropical storm or hurricane is active—and one of the most commonly misunderstood. Its main purpose is to show where the cyclone’s centre could be during the next few days. It does not outline the storm’s physical size or every place that may experience impacts.
This is an educational guide, not a current warning. For an active cyclone, always use bulletins from the responsible meteorological centre together with national and local authority warnings.
What the cone actually represents
The National Hurricane Center (NHC) forecasts the cyclone centre at a series of future times. Each point is surrounded by a margin derived from official track errors in previous years. The envelope around those margins creates the cone.
For the traditional cone, each circle is sized to include roughly two-thirds of historical position errors from a recent five-year sample. Looking at the entire forecast path, the centre stays within the cone roughly 60–70% of the time. The cone therefore communicates probability, not certainty.
Why the cone becomes wider
Observations establish the current centre, but small differences among forecasts grow with time. A modest error in direction or forward speed can create a large separation several days later. The widening cone reflects that growth in historical track error.
The narrow end does not mean a small hazard, and the wide end does not mean a larger storm. They indicate that the position of the centre becomes less certain farther into the future.
The centre line is not a compulsory route
The line linking forecast points is the official predicted track, but it is not a rail. The centre can pass on either side of it and still remain within a reasonable forecast outcome. Nor is the cone edge a wall: some cyclone centres eventually move outside it.
Focusing only on the line creates false precision. A place just away from it is not automatically safe, while a place beneath it still cannot know which part of the cyclone it will experience.
The cone is not the storm’s size or full danger area
Heavy rain, gusts, high waves and tornadoes can extend far from a cyclone centre. Rainbands may affect locations outside the cone, and large or asymmetric systems do not distribute hazards evenly around the eye.
Storm surge depends on wind, pressure, coastline shape, seabed depth and the astronomical tide. It cannot be inferred from the forecast cone alone.
Does the cone predict intensity?
Not by itself. Symbols along the track may indicate the forecast classification at particular times, but the shaded cone describes position uncertainty. Intensity has a separate uncertainty and can change quickly. Read the intensity forecast, wind-field graphics, rainfall information and official warnings rather than relying on a single map layer.
How to read a cyclone map in five steps
- Check the bulletin date, time and time zone.
- Find the current centre and separate the past track from the forecast.
- Consider the whole cone, not only the centre line.
- Add hazard layers: wind, rainfall, waves, coastal flooding and warnings.
- Compare successive updates without overreacting to one small shift.
What this means for Europe
The NHC is the regional specialist centre for North Atlantic cyclones, but its cone does not replace European warnings. If a system approaches the Azores or Canary Islands, or transitions into an extratropical low heading towards Europe, practical decisions must be based on the meteorological service and civil-protection authority responsible for the affected territory.
The 2026 season began quietly. Our Atlantic update for 12 September explains why five named storms had not yet reached hurricane strength. A quiet season to a particular date does not alter how a later cyclone forecast should be read.